CHAPTER 1:
Traffic incidents
3.180 people died in traffic incidents on the roads in Germany in 2017. Another 390 thousand were injured on the German roads in a year according to the Bundesanstalt für Straßenwesen (BASt) [1]. If you look around Europe in the E28 countries, more than 25k people died in traffic incidents in recent years reported by the European Road Safety Observatory [2]. To understand these numbers a little bit better: 390 thousand injured persons in Germany represent about 0,5% of the population of Germany. It means that in a lifetime of 70 years, you have a 35% chance of getting injured in a traffic incident in Germany.
So the question is: how would it be possible to save those lives and avoid those casualties on the roads or at least lower the number of accidents in the coming years?
Autonomous driving capabilities have been developing massively. 5G is almost here, including Vehicle to Everything; but how far we are from the solution really; how long would it take to provide a solution to bring everyone home safe?
What are the contributions and the responsibility of our Telecommunication Industry here? Could we, who are working in the Telecommunication Industry, support the design and build of a solution to make the traffic much safer? How much would it cost to develop such a solution? And finally: would it be worth spending that much money to develop such a solution and who should bear the cost of implementing such that?
CHAPTER 2:
Traffic safety, where is the industry today?
Automotive and Telecommunication & IT are two primary industries to lead traffic safety improvements. The automotive industry leads traffic safety developments, and the Telecommunication industry is in a supporting role.
Today Automotive is obviously in a more evolved position than Telecommunications regarding the transportation evolution. Assisted driving brought many new safety features in the last decades already, like safety belts, ABS, etc. In recent years, autonomous driving has taken off by new intelligence and capabilities built into the vehicle. New features, like a lane-keeping assistant, pedestrian recognition, automated emergency braking, etc. are already available. The Automotive Industry is targeting the highest possible safety level with fully automated driving modes by autonomous vehicles, which are capable of making decisions alone.
Automotive drives the evolution of transportation, which means that this industry is leading the development and implementation of new features. Other sectors, like Telecommunication, try to grab a part of the future transportation ecosystem. Nowadays, Automotive is looking around to the different industrial sectors, and running pilot programs with them, to understand, what kind of solutions could they offer for the evolution of transportation.
My opinion is that the Telecommunication Industry is quite behind. A clear roadmap of new solutions for supporting such a transportation evolution is not visible yet. That’s true that specific network demands for some transportation use cases are collected already and there are trials ongoing. But no general roadmap exists yet, which would list the supported transportation use cases and their delivery dates by the mobile service operators.
I think that two essential challenges are delaying such a general commitment by the Telecommunication industry regarding the V2X services. On one hand, Automotive is the owner of these services. It means that Automotive defines and drives the overall evolution path for future transportation; based on their industry’s genuine interest. Telecommunication needs to accept their position and try to develop solutions which create value for the Automotive industry.
On the other hand, Telecommunication has limited experience in supporting such new requirements raised by the transportation evolution. Those capabilities were not needed until now in mobile networks. Existing mobile networks are not designed to provide, e.g. application session continuity with 1-5ms latency at 200km/h speed during a 300km-long trip.
The real question of the coming years is whether the Telecommunication industry could create such valuable solutions. Today we tend to think that mobile service providers have their golden tickets to sell their solutions for the Automotive industry. But this might not happen.
Car manufacturers are looking for alternative options to connect their vehicles already. Just two thoughts: even 3GPp specifies use cases when vehicles are directly connected and using 5G technology but without using a mobile network. And not to underestimate the capabilities of the vehicle industry. (LTE Direct protocol has been introduced in 3GPP Release 12 specification already. 5G direct protocol is detailed in Release 16 as well, e.g. as an option to connect the members of a platoon [4]). Elon Musk has his satellites already to provide connectivity to his cars. I guess he is not the only one working on creating a complete ecosystem of future transportation, including the vehicles, the traffic control applications and the required infrastructure.
We’ll see in 7-10 years, whether the Telecommunication Industry is catching up with delivering the required solution in time. Otherwise, the Automotive Industry will manage to find the right infrastructure solutions to connect their vehicles and host traffic control applications.
CHAPTER 3:
A detailed look at the Automotive and Telecommunication & IT Industries
A detailed look at the Automotive Industry
The automotive industry implemented many passive and active safety solutions in vehicles during recent decades. Advanced safety features of individual cars popped up around 20 years ago, e.g. blind-spot detection of collision warning systems. In the last ten years, more and more driver assistance features and partially automated safety features became available in the cars, e.g. lane-keeping assists or adaptive cruise control. Safety features are evolving towards full automation in the next decade. The following picture depicts the evolution path of the safety systems over 70 years.
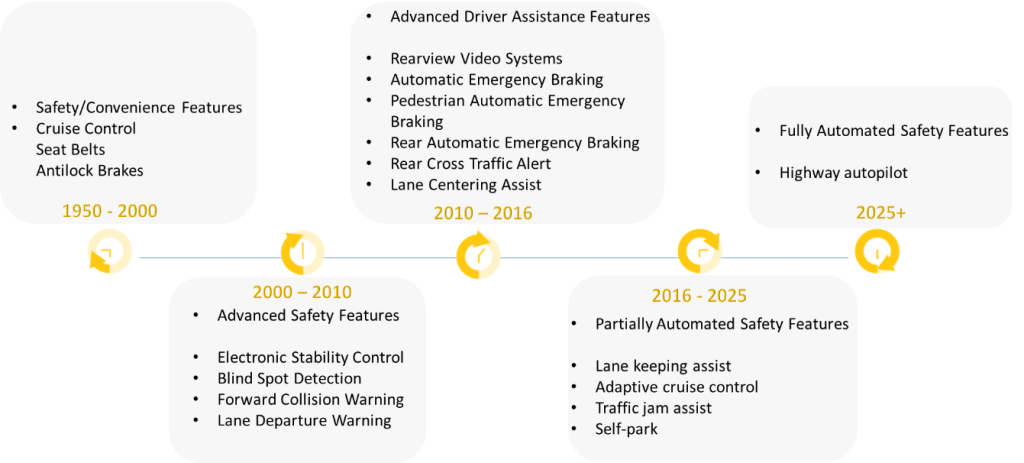
Source: https://www.nhtsa.gov/technology-innovation/automated-vehicles-safety
Moving towards fully automated safety features will require more intelligent vehicles. Therefore the evolution path of the safety improvements depends on the evolution of the autonomous vehicles. The highest safety level might be reachable with fully autonomous vehicles enabled with automated driving capabilities. It means that those vehicles could drive alone in all conditions, without human interaction or even monitoring by a human is needed.
Enabling fully automated driving is a work in progress. Today we might be somewhere in the level 1 & 2 of the table below. It means that even specific actions could be triggered by the vehicle automatically, like emergency braking, but the driver needs to remain engaged with the driving itself.
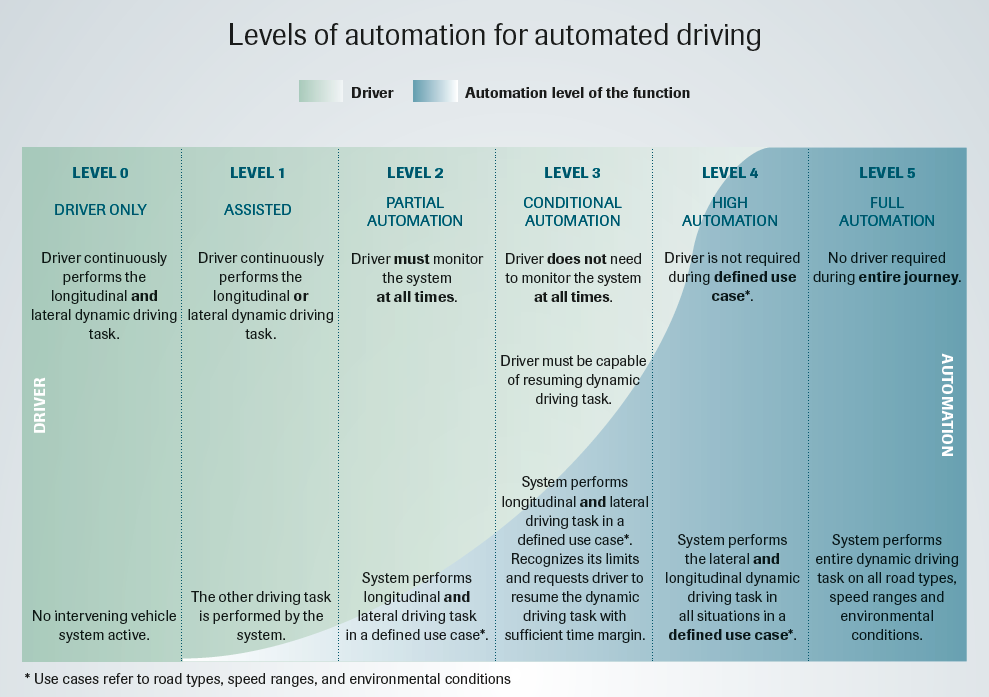
The timeline of reaching the last, full automation phase, is not clear yet. Tesla made some announcements with their expectations to provide full self-driving cars in the second half of 2020; however, some of the experts are less optimistic. [21]
A detailed look into the Telecommunication and IT industry
Telecommunication and IT (ICT) industry is the other primary industry contributing to traffic safety improvements. ICT had two main deliverables already until now. On the one hand, different ICT solutions are used in the vehicles to extend the capabilities of the individual vehicles, like processing different sensor information, supporting fully automated solutions, etc. On the other hand, outside the vehicles, ICT provided already many solutions, like route planning and map applications with dynamic contents.
The further evolution path of the ICT industry might rely on two main pillars. One pillar is to continue the application development itself to provide solutions for different traffic safety use cases. These applications would move partially from the individual vehicles towards central solutions, outside of the vehicles. Future traffic safety applications will manage complex traffic situations with the coordination of hundreds of vehicles.
The second pillar of the ICT development covers the evolution of the telecommunication networks. Proper mobile networks need to be designed and developed. Networks need to be scalable and reliable to connect all objects participating in traffic situations or sharing information for traffic situations. Apart from providing connectivity, mobile networks need to offer a dynamic hosting environment for traffic safety applications too.
CHAPTER 4:
Traffic coordination capability shifts from individual vehicles to central applications
Traffic safety improvement will depend on the capability of processing more and more information from as many information sources as possible. Traffic management solutions might move from individual vehicles to centralised applications in the future. Central applications could manage more complex traffic situations by using more information sources and controlling more vehicles in a coordinated way.
Just imagine the following situation: you are approaching a crowded city centre where limited free parking slots are available. Let’s assume that you, like all other people, want to arrive as soon as possible in the city centre; and spend as little time in the traffic as possible. Your car is capable of detecting the free parking slots along the streets, like vehicles already capable of doing so today.
The goal of the overall traffic efficiency is to transport all people in the most effective, fastest way to the city centre. This requires a coordinated distribution of the cars and the free parking slots. Some vehicles could take the free parking slots along the road, but others do not. Therefore some vehicles need to stop in a further distance from the city centre and move the passengers, e.g. with public transportation.
In the first model, your car individually tries to recognise the free parking slots along the roads; as all other vehicles do. There is no coordination among the cars, so vehicles are fighting for the same free parking slots. This model is not that efficient.
In the second model, you target higher traffic efficiency by enabling vehicles to communicate with each other. In this case, cars are connected and could share information about their actual locations. Also, vehicles could share their knowledge of the free parking slots, which are detected by their sensors.
The vehicles are connected; however, the contests for the free parking slots are still existing. So further clarification is needed: who is deciding on which vehicle takes which fee parking slots and which cars need to park in the distance? What is the decision process looking like? Which car should make decisions? More cars to share the decision-maker role? How to manage the dynamics of the vehicles joining and leaving a specific traffic situation, like moving out of the city centre?
The third model would bring the highest efficiency by collecting information from all vehicles and making the decision centrally. The decision-making authority moves to a central application. All vehicles are responsible for themselves: sharing information to and executing the orders received from the central application.
The parking slot allocation will be done centrally to ensure the optimum solution. Some vehicles will park at certain distances. All vehicles are controlled in a coherent way to ensure the shortest travelling time for the entire passenger base. Central coordination offers other advantages, as dynamically changes the parking slot allocation model according to the overall traffic patterns. E.g. on weekends, the parking slot allocation is favourable for the inhabitants; meanwhile, during the weekdays, the parking slot distribution is based on the number of passengers in the vehicles.
The next section describes a general evolution path from single vehicles to a central traffic management system.
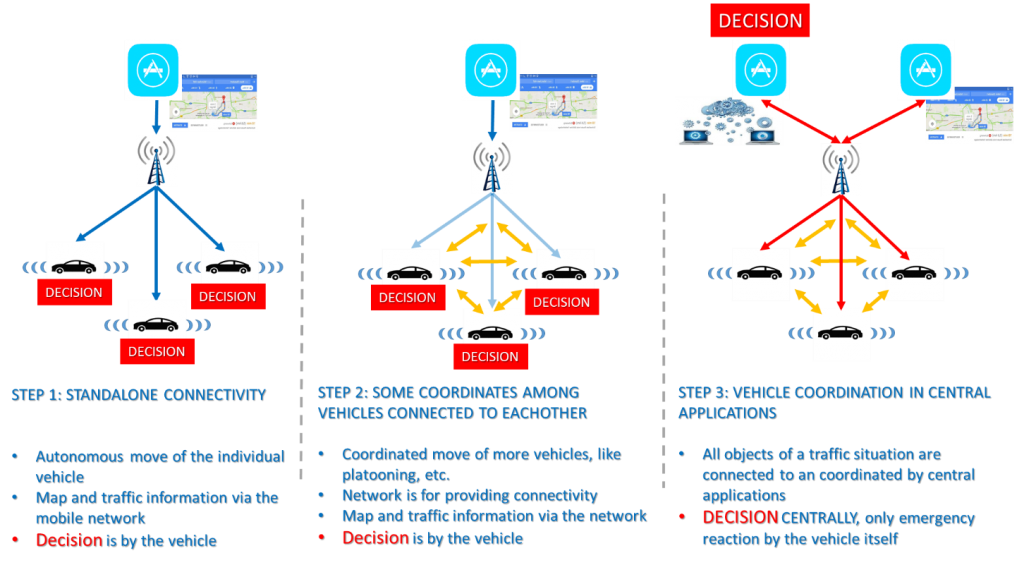
In the STEP 1 phase, the autonomous vehicles might mainly rely on the information collected by their sensors. Vehicles are making decisions, like accelerating, braking, and turning autonomously. At this step, some information is used from external sources; mainly maps and relevant traffic information, jams, and roadblocks. Local Dynamic Map provides [discussed in a separate blog post] an example of the evolution of the development and usage of traffic information. At this phase, vehicles are not connected.
STEP 2 introduces some level of coordination among a smaller group of vehicles on top of the capabilities of STEP 1. Vehicles are connected directly or via the mobile network and are capable of performing coordinated movements. Such moves might be platooning (mounting and dismounting chain of a small group of vehicles), coordinated lane change, and other use cases. In STEP2 vehicles could share sensor and state information with other vehicles in the same group. (Ref. [4] Specification # 22.886 – 3GPP, Study on the enhancement of 3GPP Support for 5G V2X Services. ’ Chapter 5: Use Cases’). The decision is still with individual vehicles.
Connecting vehicles could increase the overall density of the roads. Maintaining shorter gaps in a coordinated way among the vehicles could result in 2 times higher traffic density according to the study of Impacts of Cooperative Adaptive Cruise Control on Freeway Traffic Flow by Steven E. Shladover, Dongyan Su, and Xiao-Yun Lu [28]
Targeting the highest safety might require taking a 3rd STEP. The highest safety requires collecting information from every possible source and coordinating all objects together in traffic situations. Objects with engines, like cars, trucks, buses, trams and trains; but man-powered objects also, such as pedestrians, bicycles, scooters, etc. A high number of different kinds of objects need to be coordinated in STEP 3. Connecting and directing all these objects together will lead to even better utilization of the roads. Therefore less time is required to get from A to B.
STEP 3 would enable the introduction of certain prioritization among vehicles, e.g. providing always green lights for dedicated vehicles based on the number of passengers or reason for the travel. The required coordination of all kinds of vehicles might move from the individual vehicle to a central application. The vehicle could take emergency moves autonomously every time if necessary.
Where to host a traffic control application?
Theoretically, we might use the grid of vehicles to host the traffic control application. In this case, there is no dedicated application hosting central location and the application is distributed over many vehicles which are in the same traffic situation. Something like this:
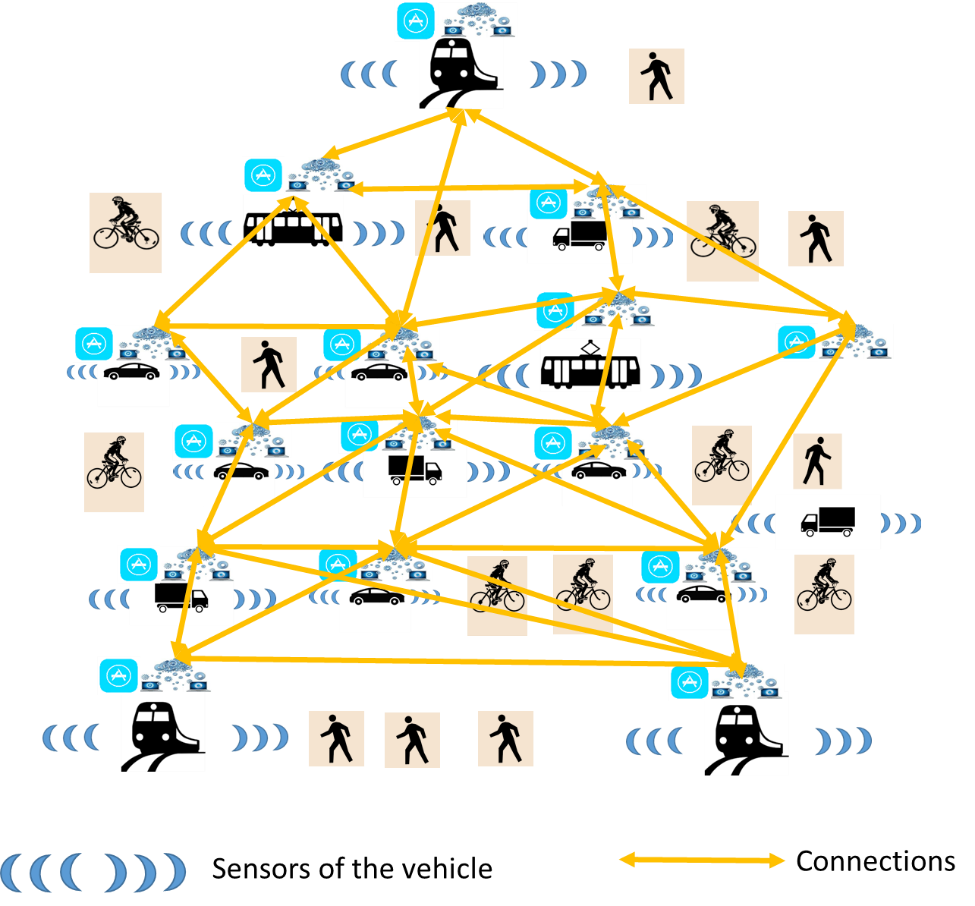
There are many challenges to developing such a distributed architecture. The first issue is to create the grid itself and to manage the connectivity among all the vehicles. Initiate or terminate the connectivity dynamically between one and multiple vehicles when a vehicle is joining or leaving a traffic situation. Imagine a group of 5 vehicles, where 10 connections would be enough to connect all vehicles to each other. But in the case of 10 vehicles, 45 connections are needed, and in the case of 100 vehicles around 4950 links would be required to create a full mashed connection matrix.
Different initiatives and projects are run by the Automotive Industry to exploit such a communication option for short and long-range connectivity of the vehicles.
Apart from the number of connections, the decision-making process of such a grid of vehicles would be another issue. Many decisions would need to be made per every individual vehicle in every second. A cooperative decision-making solution is expected to override the planned decision of the individual vehicles because of prioritises the efficiency of the entire grid above the efficiency of the individual vehicle. Such a cooperative decision-making process is complicated. All decision-maker is equal, and the decision-making process itself is distributed among many vehicles, such as compute engines.
These vehicles, as compute engines of the distributed application, are changing their physical location in a traffic situation. The vehicle is moving, even leaving the grid when leaving the traffic situation. Implementing a lead decision-maker role would be an option but might work with a small number of vehicles (<5) for the same reason as before, probably like in case of the platooning. But in the case of dozens or hundreds of vehicles, the decision-making needs to be centralised and must cover all objects belonging to the same traffic situation.
Therefore using a centralised application might be the long-term target solution, something like this
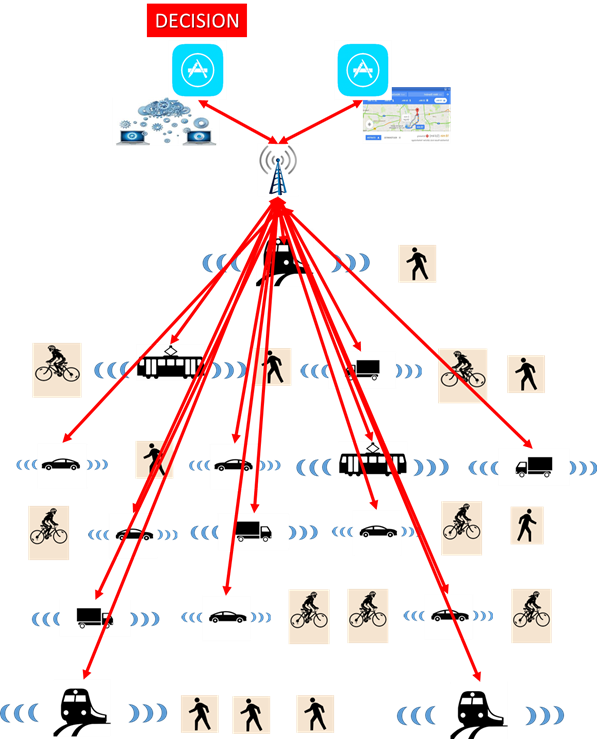
With a central traffic management solution, the decision-making process becomes more straightforward. All vehicles receive instructions from a central application. A central application considers all active and passive objects (all engine and man-powered objects, roadblocks, etc.) which might have an impact on a given traffic situation. The vehicles might compare the instructions of the central application to their independent judgments of the traffic situation, but they follow the central instructions. Vehicles would deny the received instructions only in case of emergency. The overall traffic safety and efficiency could improve with a central decision-maker solution.
CHAPTER 5:
The definition of the traffic system which could be controlled by traffic management applications
The ‘Roads in Germany’ is an abstract terminology, so we need to break down this term to physical traffic situations, including locations and objects which we could work on to improve their safety. As the first step, we break down the overall traffic into individual traffic systems. A traffic system is a minimum traffic unit and contains all objects that can physically interact with each other. These objects could cause an incident to another object or could be harmed by other objects in such an event. All objects in the traffic system need to be controlled together, likely by one application or one application instance.
Such traffic systems are forming and ceasing dynamically. The number of such traffic systems and the number of objects in a given system is changing dynamically and continuously.
Objects in a traffic system could be:
- moving objects, like cars, trucks, trams, trains, buses, bicycles, pedestrians even un-manned objects like ball passing the road or
- steady objects in the path of another moving object like parked cars, roadblocks, and holes on the road ahead.
Objects do belong to the same traffic system if they can physically interact with other objects in the system. The number of objects in a traffic system needs to be a minimum of 2; the maximum number depends on the speed of the objects. That is because objects can reach different distances at various speeds. For E.g. an object moving at 200km/h has an extended physical area where it could interfere with other vehicles. Whereas at 10km/h speed, the object could stop at very short distances, which results in a small physical area to interfere potentially with other vehicles.
Interaction happens in a traffic system when a vehicle is forced to change the speed and/or direction to avoid collisions because another object changes its speed or direction.
Examples of traffic situations to be covered by a traffic management application
This section illustrates various traffic systems that could be formed in a traffic situation.
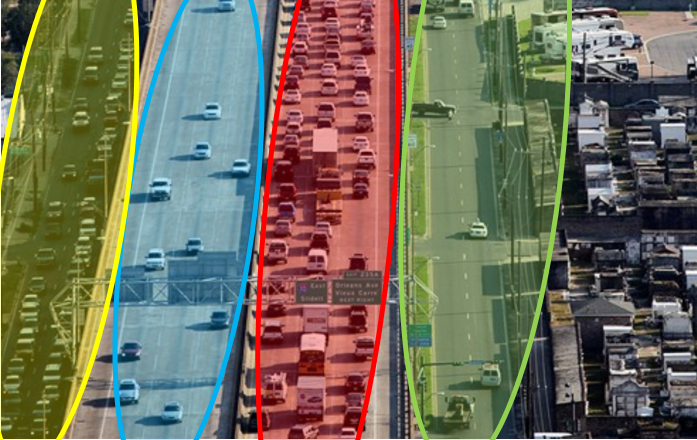
In the 6th picture, there are four different traffic flows. The different colours mark the objects which are belonging to various traffic systems. The red and blue traffic systems are in opposite directions on the bridge, physically separated from each other. The yellow and green traffic systems are on the ground level at both sides of the bridge and each has one direction. They are separated physically from each other and form the two other systems on the bridge as well.
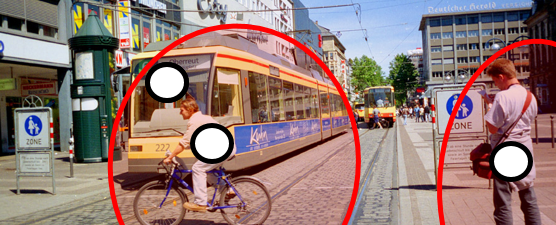
In this picture, all the marked objects belong to the same traffic system, marked red. The tram, the bicycle, and the pedestrian are close enough to interact with each other; therefore, they define a traffic system of 3 different types of objects.
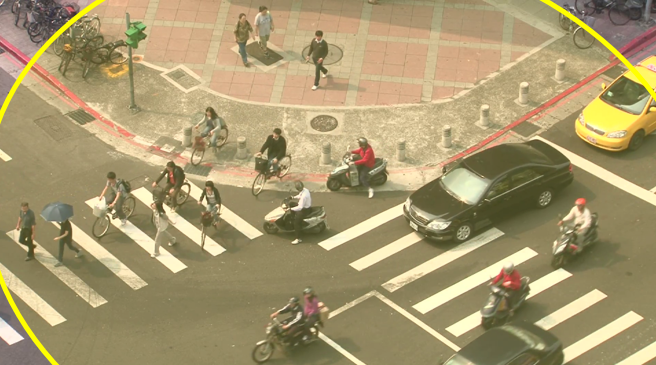
All objects in the yellow area are in the same traffic system. Cars, pedestrians, bicycles on the pedestrian crossing, and motorbikes are in the same traffic system because they can physically interact with each other.
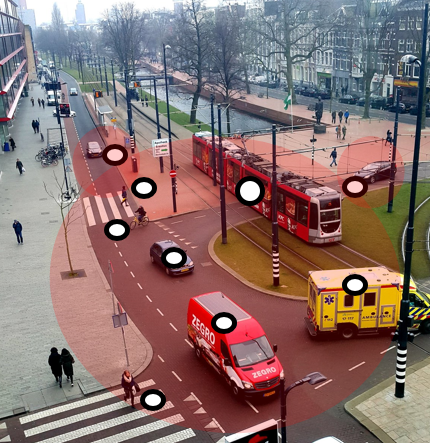
Not all objects in this image belong to the same traffic system. Only those, which are each other in the red area: 3 cars, 2 vans, a tram, a bicycle, a pedestrian on the crossing in the middle part and another pedestrian crossing in the lower part of the picture. These moving objects belong to the same system. Other pedestrians and cars on the top of the image don’t belong to this traffic system, because their speed or directions could remain unchanged for a longer period regardless of the objects in the red area.
The size of a traffic system
A traffic system needs to cover all the objects that could interact with each other. Therefore, the physical size of the traffic system depends on how far a vehicle can reach in a given time. The time could be set to 5 seconds, like the value that is used by 3GPP [4]. Therefore the size of the traffic system depends on the speed of the objects in the traffic system.
The following example from a 3GPP use case shows a possible way to calculate the proper size of a traffic system.
The Information sharing for partial/ conditional automated platooning use case in the 3GPP specifications [4] set 5 seconds for the mobility scenario. It considers all objects that are at a 5-second distance from each other at any given speed. That means in the case of urban situations, where the maximum relative speed is 100 km/h (50km/h per direction), the size of a traffic system could be up to 139 meters. Whereas ‘… [278] m for the maximum relative speed of [200] km/h in suburban, and [347] m for the maximum relative speed of [250] km/h in Autobahn (same direction)….’ [Specification # 22.886 – 3GPP, Page 33]
The size of the traffic system is likely not to be static and dynamically changing based on the changing speed of the objects.
The primary safety target of a traffic system is to avoid collisions
In the previous chapter, we defined traffic systems, which include all objects that possibly interfere with each other or might collide with each other. The next question is how to avoid collisions in the traffic systems.
An obvious solution to deliver 100% safety for a traffic system is when all objects are stationary, so having a speed of 0. Without moves, no incidents could happen, and zero fatalities are guaranteed immediately. However, this is not a real traffic system because traffic means that objects are moving from point A to point B.
The question is whether there is a clear correlation between speed and safety, or not. If yes, then how much could we accelerate the pace of the objects and in parallel, still be able to keep the guaranteed zero casualties in the system?
To design the proper traffic management solution, we need to understand the correlation between speed and the capability of guaranteeing the highest safety. One extreme when the speed is 0, but as we saw, that’s not a traffic system. The other extreme is that all objects are moving at their maximum speed even in cities, and not slowed down to 50km/h by various speed limitations in different areas. Driving at the high speed of a particular object would be allowed if all other objects could be fully controlled in the same traffic system.
The highest level of control of a moving object is the complete stop of the move immediately. One of the extreme demands against such a control application is to completely stop one or multiple objects of a traffic system in a possible emergency. And exactly this is a level of traffic control which needs to be enabled by a traffic control solution or application.
The effectiveness of a traffic control application depends on the time which is needed to make proper decisions and send instructions to the vehicles. The first question is: what is the required speed of the decision-making process and what are the expected safety benefits of a fast decision-making process? The second question is: what is the distance needed between the objects and a control application? Where shall be these traffic control applications hosted in the network?
The next chapter is about to define the required reaction time of such a traffic control application.
CHAPTER 6:
STOPPING DISTANCES – WHY WE NEED AUTONOMOUS VEHICLES AND TRAFFIC CONTROL SOLUTIONS
This chapter tries to define the expected speed of the decision-making progress for autonomous vehicles and traffic control applications. As we saw in the previous section, the highest level of applied control for a moving object is the stop the move entirely. Therefore in this chapter, we analyse the options and benefits of reducing the stopping time and distance.
Stopping distances
[PLEASE NOTE THAT I CALCULATED THE BRAKING DISTANCES ASSUMING THE DISTANCE IS LINEAR TO THE SPEED DURING THE BRAKING PROCESS FOR THE SAKE OF THE SIMPLIFICATION OF MY MODEL. IN REALITY, BRAKING IS NOT A LINEAR PROCESS.]
The needed time and distance to stop a vehicle is a summary of two factors. The total stopping distance consists of the sum of the ‘perception-reaction distance’ and the ‘braking
distance’.
- Perception-reaction distance: the distance taken during the time of perceiving the information and reacting with a move, like pressing the braking pedal.
- Braking distance means the needed range to slow down the vehicle to zero.
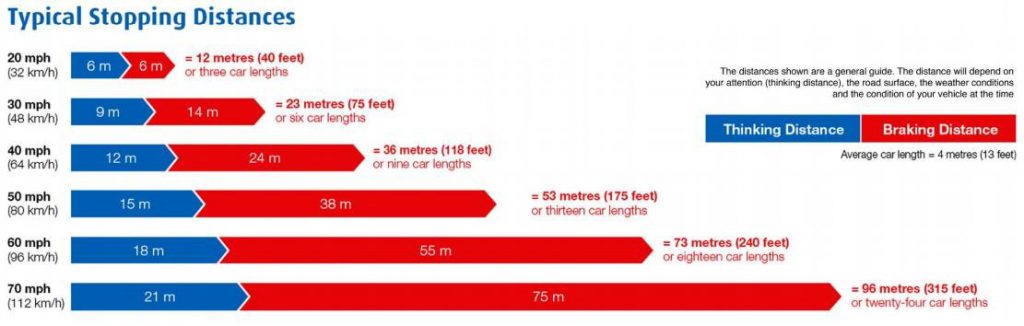
Source: Perception-reaction and braking distances. Source: https://www.brake.org.uk/facts-resources/15-facts/1255-speed
The picture above shows the total stopping distances at various speeds. The stopping distance is the summary of the two phases, represented by the blue (thinking time = perception and reaction time) and red (braking distance) bars. Two comments to the picture:
- In this chart, the perception-reaction time is set to 0.67 seconds, which is far better than the 1.5, 2, or even 2.5 seconds used by the experts for typical traffic situations.
- Today the braking distances might be even shorter compared to the values in the picture because the UK Department of Transport published this chart in 2007. The assumption is that the braking distances might be shorter today because of the developments of vehicles in the last 12 years
Perception-reaction time
Perception-reaction time could be calculated in many ways, and different values are in use, such as the 0.67% in the previous charts. The relevant quote from Wikipedia:‘…Experts historically used a reaction time of 0.75 seconds, but now incorporate perception resulting in an average perception-reaction time of 1 second for the population as an average; occasionally a two-second rule to simulate the elderly or neophyte; or even a 2.5-second reaction time—to specifically accommodate very elderly, debilitated, intoxicated, or distracted drivers…’ [6. Braking distance – Wikipedia. https://en.wikipedia.org/wiki/Braking_distance]
Another approach to defining the human perception-reaction time is to use the reaction time needed by the human driver to take back control of the vehicle when the fully automated driving mode is interrupted for any reason. This interruption, disengagement, means ‘…When automated driving fails, or is limited, the autonomous mode disengages and the drivers are expected to resume manual driving…’ [25] California Department of Motor Vehicles (DMV) shared the annual report in 2016 with the following companies reported on autonomous vehicle trials from September 2014 to November 2015 in California (Bosch, Delphi, Google, Mercedes-Benz, Nissan, Volkswagen Group, Tesla).
The stable distribution of the time needed to take back the control by the human driver was 0.83 seconds on average during this trial. [25]
From now on, I use 1 second as a human perception-reaction time for further calculations.
The distance passed in the perception-reaction phase
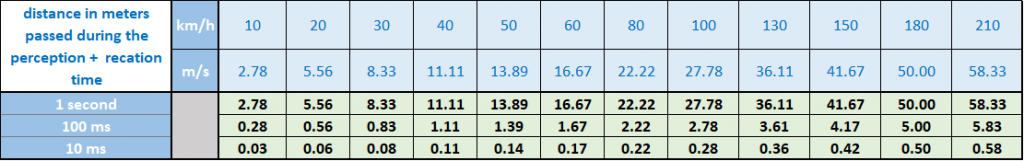
Picture 12 shows the passed distance in meters at various speeds and various perception-reaction times. Perception-reaction time is independent of the type of vehicle.
- 1 second: during a 1-second perception-reaction time the vehicle passes 2.78 meters at a 10km/h speed. With 50km/h speed, the vehicle takes 13.89 meters during the 1-sec perception-reaction phase, and at 210km/h the vehicle passes 58.33 meters.
- 100 ms: this value might represent a possible perception-reaction time of a machine driver. Machine drivers are supposed to be much faster than human drivers; e.g. Infineon Technologies AG [26] set a 100 ms expected reaction time for a machine driver.
Such a machine driver could be local, in the vehicle, like the fully automated car itself. Or the machine driver could be remote, in an application in the cloud. In the case of remote driving, the 100ms perception-reaction time needs to cover the latency time between the vehicle and the application plus the application processing time.
100ms perception-reaction time provides ten times shorter perception-reaction distances comparing the 1-second time. This statement is obvious, and the impact is impressive: at 50km/h speed, the range for the perception-reaction phase is 1.39 meters versus the 13.89 meters required with 1 1-second perception-reaction time.
- 10 ms: this value is popping up in various standards, like in 3GPP TR 22.886 [4], as an overall latency time supported by the network in the case of specific use cases.
10ms perception-reaction time obviously provides a hundred times shorter distances comparing the 1-second time. At 50km/h speed, the distance for the perception-reaction phase is 14 centimetres versus the 13.89 meters required with 1 1-second perception-reaction time.
Braking distance
Meanwhile, the perception-reaction time is independent of the vehicle’s type; the breaking distance defers in the case of different vehicles.
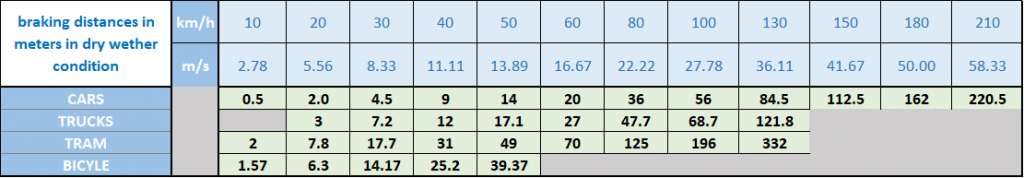
Picture 13 shows the braking time of different vehicles in typical traffic situations. These could be cars, trucks, trams, and bicycles. [Sources: 7,8,9,10,11]
Cars have the shortest braking distances. Trucks have 30-50% longer braking distances compared to the cars. The trams’ braking distances are about 3.5 times longer than the cars’ braking distances. The bicycle braking distances are around three times longer compared to cars.
The braking distances might have been improved since the related reports were published, which are used as sources for the calculation. In case the braking distances are shortened, the perception-reaction phase has a more prominent role in lowering the total stopping distances.
Stopping distances
Cars
The next table shows the total stopping distances for cars.
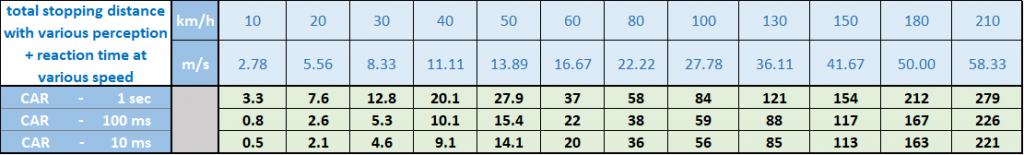
Decreasing the
perception-reaction time has a serious positive impact on the total stopping
distance at low speeds. With 100ms perception-reaction time at 10km/h speed, you could gain 76% of the total stopping distance (0.8m) compared to 1 sec perception-reaction time (3.3m).
At 50 km/h, the car could stop at 15 meters instead of 27.9 meters, which means the total stopping distance is around 13 meters shorter. At 130km/h, the car could stop 50 meters sooner with 100 ms perception-reaction time.
Further improvement of the perception-reaction time from 100ms to 10ms doesn’t shorten the stopping distance significantly.
Trucks
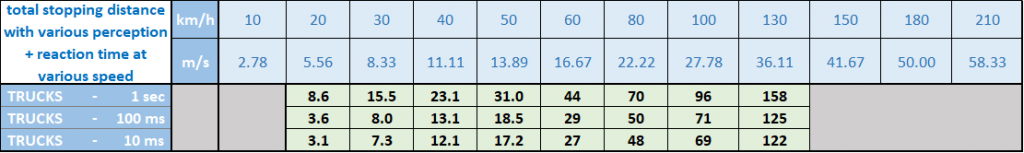
In general, lower perception-reaction time brings a similar impact for the trucks as the cars on the stopping distance.
Trams
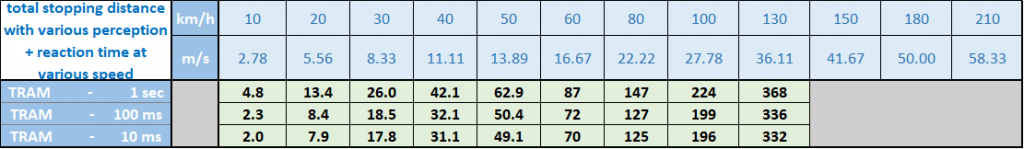
Trams’ stopping distances are overall much higher compared to cars and trucks. Similar to cars and trucks, decreasing the perception-reaction time to 100ms has a positive impact on trams as well. However, because of the approx. 3.5 times higher braking distances, the
gain of the 100ms perception-reaction time has a lower impact on the total
stopping time. With 100ms perception-reaction time at 10km/h speed, you could gain 52% of the total stopping distance (2.3m) compared to 1 sec perception-reaction time (4.8m).
At 50 km/h, the tram could stop at 50,4 meters (100 ms) instead of 62.9 meters (1s), which means the total stopping distance is around 13 meters shorter.
A traffic control application needs to manage the trams and trains with consideration of their longer stopping distances.
Bicycle
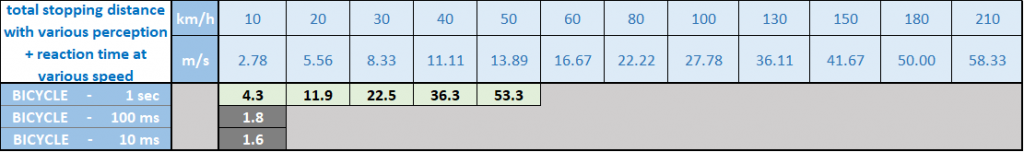
Analysis for bicycles: stopping distances of a bike are overall much longer compared to cars and trucks and around 20% better only than the trams. However, the bike is a man-powered object, so the calculation would make sense with only 1s perception-reaction times for the bicycle.
THE NEED OF AUTONOMOUS VEHICLE AND TRAFFIC CONTROL SOLUTIONS
Autonomous vehicles have better reaction time than humans do. Machine drivers will deliver shorter stopping distances and, therefore, contribute to higher traffic safety.
However, autonomous vehicles might have limitations in their decision-making process, especially in case of high traffic density. Collecting information from a large number of other vehicles, stationary objects and RSUs and calculating the most efficient moves is a complicated task. Therefore not that likely that each vehicle could have the required computing power to perform a complete modelling of the entire traffic situation. Such a missing computing capability might result in suboptimal decisions by the individual vehicle leading to less effective traffic. A central decision-making solution for all vehicles would increase traffic efficiency.
The goal is to design traffic control solutions that instruct all engine-powered vehicles with consideration of all other man-powered or stationary objects, which cannot be guided. Such a central traffic control solution would contribute to:
- Ultra-high level of safety because of harmonising and controlling the movement of all objects in a traffic situation.
- Increase the speed of the vehicles to bring people or goods from A to B. Moving faster than the current speed limits would result in less time needed for travelling.
- Increase the traffic density on the roads, which would lead to fewer roads being required for the same amount of traffic.
- Prioritisation of all vehicles based on the number of passengers or any other parameters, which would enable programmable transportation.
As a first step, autonomous and fully automated vehicles need to be on the roads as soon as possible. In parallel, we need to design central traffic management solutions and move the control from the individual vehicles into such applications.
A central traffic control solution could be an additional significant step towards traffic safety and efficiency.
CHAPTER 7:
APPLICATION AND NETWORK DESIGN FOR A TRAFFIC CONTROL SOLUTION
Designing a traffic control solution requires both application development and network development. Application development is responsible for the information collection and decision-making process. The network needs to provide the connectivity of the traffic objects with proper coverage, throughput, resiliency and mobility.
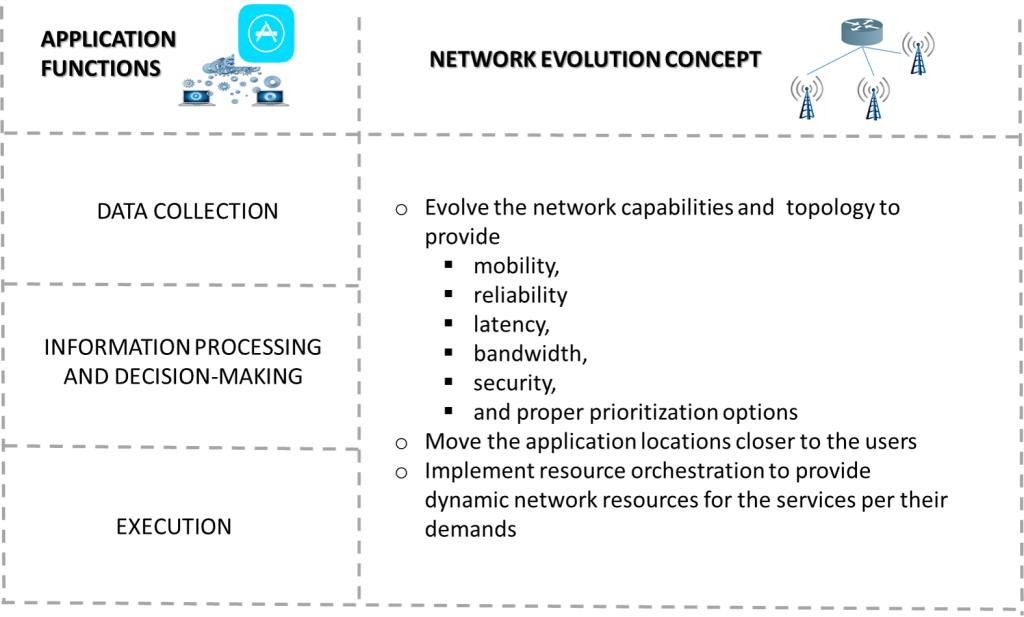
The application is responsible for three main functions: data collection, information processing and decision-making, and execution.
Networks need to provide connectivity for the traffic objects with proper KPIs, like coverage, throughout, resiliency, and mobility. Networks shall also host the applications closer to the customer because of, e.g. the low latency requirements with high speed. Finally, network resource orchestration needs to be implemented to manage the dynamic service needs, e.g., moving the traffic control application session with high speed and low latency in a state-full mode along with the traffic situation.
Application design
The main tasks of the three main application functions are the following:
Data collection process: in the data collection phase, all relevant data from the moving and stationary objects need to be collected and forwarded to the information processing systems.
Information
processing and decision-making: in this phase, the different received information needs to be correlated. Traffic control application makes decisions based on pre-defined models and rules. The output of the decision-making phase is requesting particular objects in the traffic situation to change their speed and directions. The efficiency of the decision-making process would be continuously developed. Traffic control applications are good candidates for applying Machine Learning methods.
Execution process. During the execution phase, the object changes the speed and or direction and communicates back the results to the traffic control application.
Required Mobile network capabilities
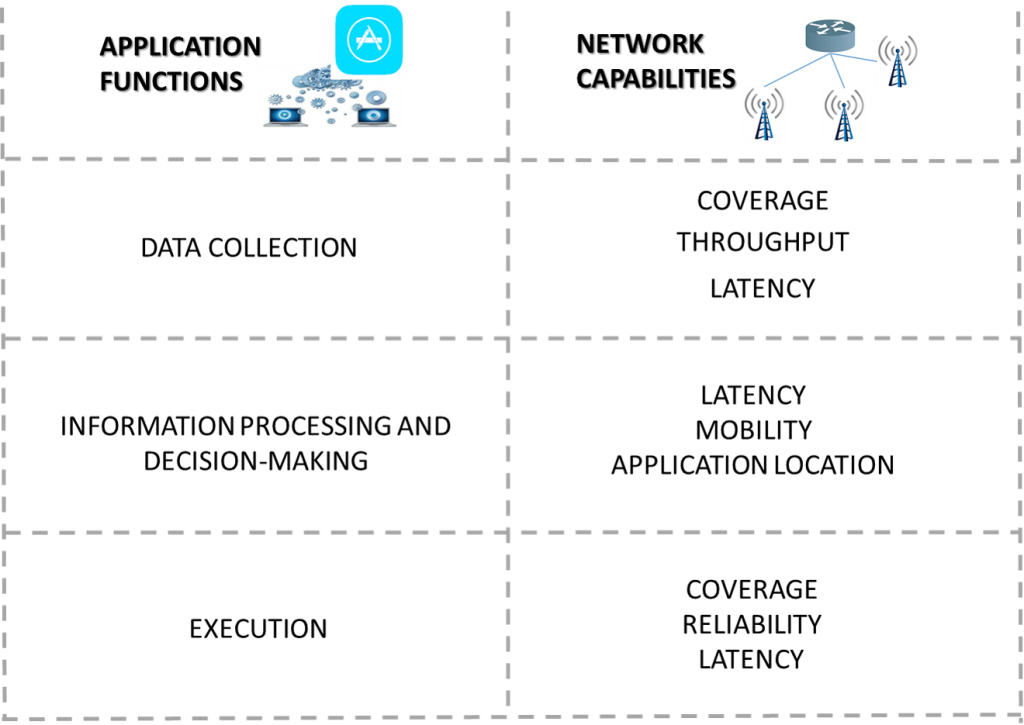
The three application functions require different network capabilities.
- The data collection phase needs consistent and
coherent coverage areas, very high uplink and downlink throughput and
ultra-low latency. - Information processing and decision-making require
ultra-low latency and high mobility to be able to provide instructions to
the traffic objects. Also, the traffic control application needs to be
hosted at the network edge. - The execution phase, where the central application
and the vehicles exchange the instructions and the acknowledgement messages,
requires consistent and coherent coverage areas with ultra-high
reliability.
Needed mobile network evolution
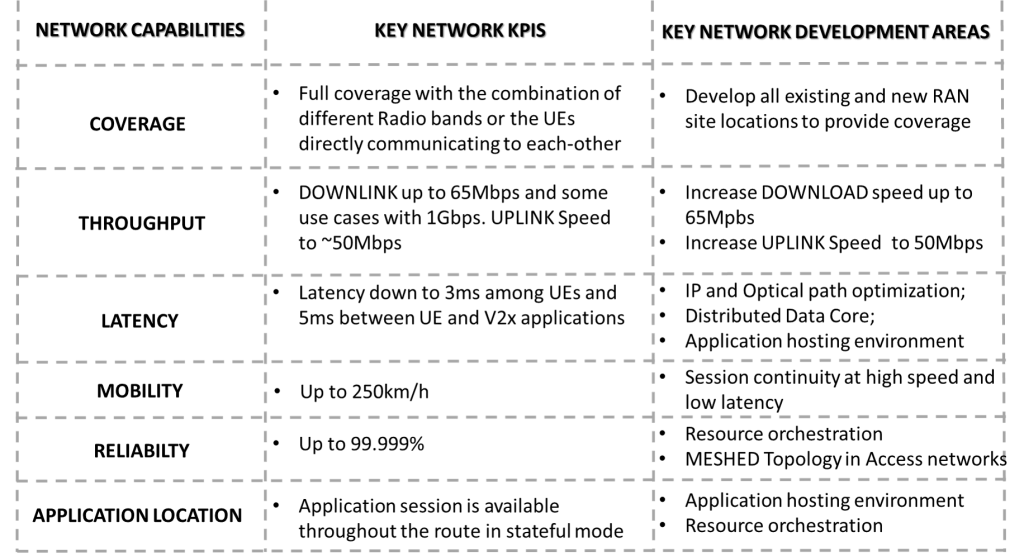
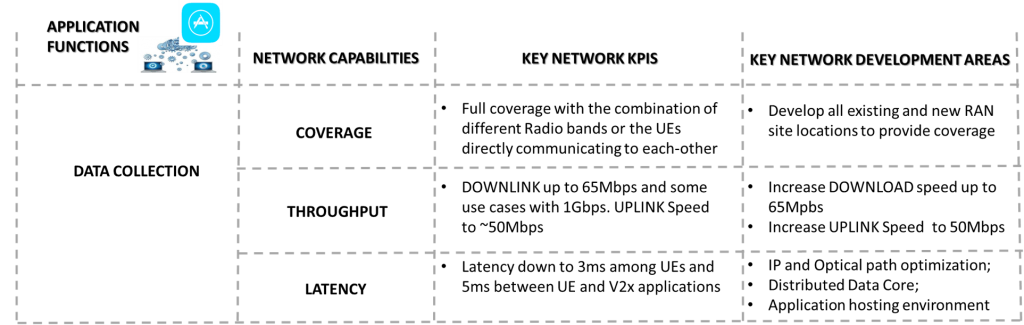
Mobile network evolution focuses on implementing the required network capabilities, which are collected in the previous section. The following picture maps these new V2x service capabilities to network KPIs. Standardization bodies, like 3GPP, already describe the new capabilities in multiple technical specifications. [4]
The Key Network KPIs column represents the highest KPI per different network capabilities, which need to be enabled by a mobile network. The assumption is that not all KPIs will be
required together everywhere in the network. Location-specific KPIs will be defined by the different types of 5G use cases, which need to be provided on certain parts of the network.
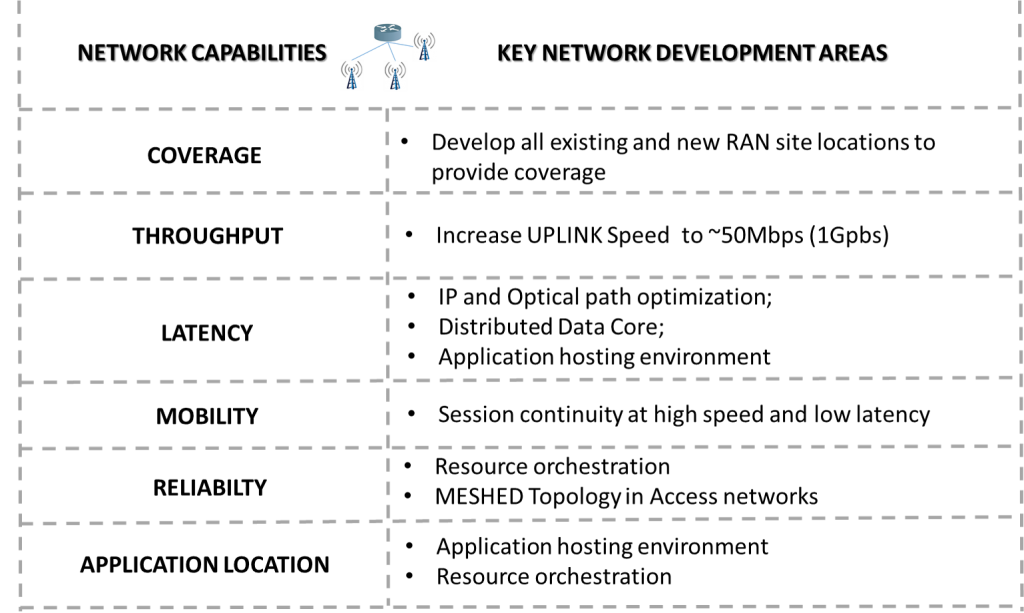
The final step of defining a mobile network evolution is to collect all activities, which are needed to enable these KPIs in mobile networks. The following table describes the main network improvement tasks per various key network KPIs.
Some network development tasks deliver a general capability everywhere in the network; like implementing network resource orchestration or designing an application hosting environment outside of the data centres. Crucial other development tasks will be relevant in particular locations or parts of the network, like reliability, coverage, throughput or latency.
CHAPTER 8:
MAIN FUNCTIONS OF A TRAFFIC CONTROL SOLUTION AND RELATED NETWORK DEVELOPMENTS
his chapter is to describe the three primary application functions and related network development actions.
The data collection phase of the application
The data collection phase gathers the required information from the objects in a traffic system.
This application function is responsible for:
- identifying the objects, which could collect and transmit information and defining those objects that could not;
- identifying the different types of information which is needed and could be collected from the objects;
- transmit the collected data from the objects to the traffic control application
Object types for collecting information
In the traffic system, there are active and passive objects.
Active objects are either object:
- which are collecting and sharing information to the central application AND could be controlled remotely, like vehicles;
- or collecting and sharing information but CANNOT be controlled remotely. These objects like RSU (Road-Side Unit), pedestrians, or any man-powered vehicles. For the latter categories, the data collection and sharing would happen via mobile phones or similar devices.
Passive objects are not connected to the network or an application, like parking objects, a hole in the road or a fallen tree, etc. Therefore, they need to be recognized by a connected object which could share information on passive objects, like an engine or man-powered vehicle or by an RSU.
Collected information type
Active objects in the traffic system could collect and share information
- as of the vehicle itself,
- from the surroundings of the vehicles perceived by the sensors of the vehicles; mobile phone capabilities would limit the information collected by a man-powered object.
- received from different types of RSUs, such as various equipment installed along the roads, like radars, traffic counting/monitoring systems, traffic lamps, etc.
- Or by any other SIM cards which is present in man-powered objects, like pedestrians, scooters, and bicycles.
Information from the vehicle and the surroundings perceived by the vehicle
The first step is collecting information about the vehicle itself. The most important information is the move itself: the position*, the speed, and the direction. Additional important information is the condition of the vehicle that would help to create a better prediction of the reaction of the vehicle if the speed and direction of the move need to be suddenly changed because of the change in the traffic situation. Additional information could be the status of the tyres, brakes or engine, etc.
*The accuracy of positioning needs to be further improved. The standard GPS technology could provide an accuracy of approx of 10m, which would be not good enough for a traffic control solution. There are more location positioning technologies available already and improving continuously. The assumption is that even smaller handsets and terminals could reach the positioning accuracy of cm, possibly with the combination of multiple positioning technologies in the next years.
The other set of information collected by the vehicle is about the surroundings of the vehicle. Important to collect and share the information gathered by a vehicle, like a roadblock or a hole on the road, because these passive – not connected – objects could not be seen by a central traffic control application in other ways.
Autonomous driving is already happening, so the assumption is that the data collection process from the vehicle and the surroundings is mature enough. Relevant data for the autonomous driving capabilities are already defined and being rolled out to the vehicles in multiple steps. [12]
Man-powered vehicles and pedestrians shall provide the necessary information about their moves via mobile phones or terminals. Most likely, only limited information from their surroundings could be collected.
Information from RSU
RSU could collect and share a vast amount of information, like traffic monitoring video streams. Different RSU types collect and share very different information.
The success of the data collection part of the application depends on the identification of the proper information sources and the quality of the correlation process of the different collected information. It is also needed to find the appropriate mix of the data from the vehicles and the RSUs.
Required mobile network development to support the data collection phase of the application
The data collection phase raises the following demands against the mobile network:
- Provide
proper coverage to ensure connectivity for all objects; - Provide
adequate bandwidth to transmit the required information from the objects; - Provide
low latency to support a fast information transmission process;
Using SIM cards for authorized communication of the objects
Using a mobile network, we could collect information from every object being/having a terminal and authorized by a SIM Card. For traffic control applications, we could use SIM cards in a vehicle, in a road infrastructure object or even in a phone. All engine-powered vehicles most likely will be soon connected to different applications via different networks. Meanwhile, man-powered vehicles, like bicycles, scooters or pedestrians, would likely not have an integrated SIM card in the future. For the man-powered objects, probably the best option for communication would be a mobile phone. It could provide information regarding the move; however, a mobile phone could not directly control the movement of the man-powered vehicles.
Old network dimensioning methods for Mobile networks
In the past Mobile networks were typically dimensioned based on coverage requirements, the number of parallel connections, and the expected bandwidth per connected devices. Low latency and high mobility requirements are quite new for mobile networks and raised by the Advanced 4G and 5G use cases. In the past mobile networks were optimized for providing the shortest path to the internet. Mobility with seamless session continuity was provided for large geographical areas by the core nodes (MME) in central mobile core locations.
1st related Network capability: Coverage and providing connectivity
Governments typically define >90% coverage requirements for mobile networks when issuing licenses to the Mobile Operators. Percentage value represents the population coverage and not necessarily the geographical coverage and coverage holes are expected in the mobile network in different locations.
Different frequency bands could be used to provide coverage
The volume of the transmitted traffic depends on the used frequency ranges and not the used frequency bands. That means that using, e.g. a 10Mhz range on the 700MHz or 10MHz on the 3.5GHz bands would result in the same bandwidth. Lower frequency bands are better to address the coverage requirement because of the propagation of lower frequency is better. However, in the lower frequency bands, there is typically less frequency available, e.g. altogether 30MHz UL and 30MHz DL spectrum for all Operators. To be able to transmit a higher amount of traffic, additional higher frequency bands and ranges are needed to provide high enough capacity.
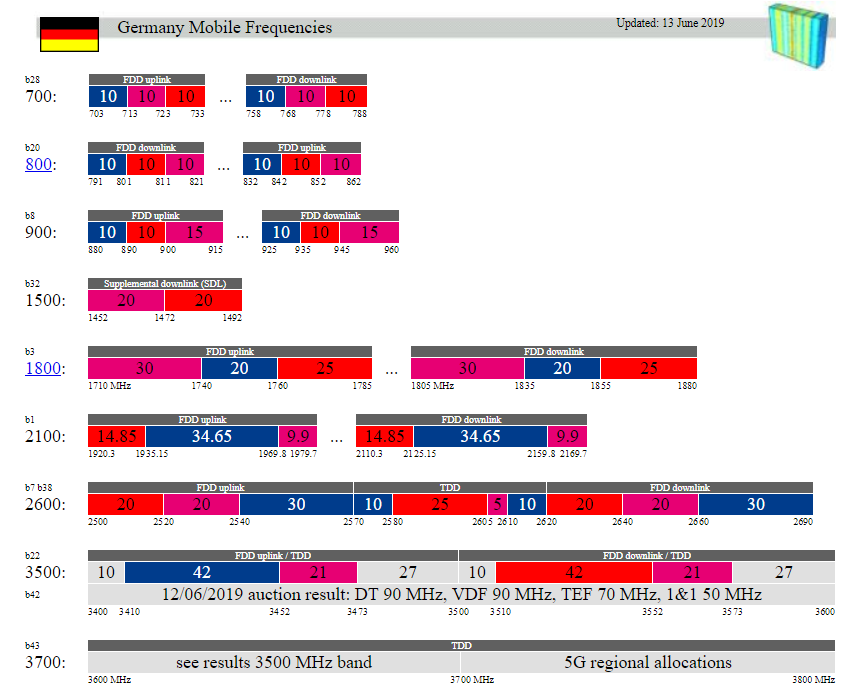
Picture 23 contains the used spectrum in Germany before the 5G auction. Different frequency ranges are available per various frequency bands. There is a 60 MHz frequency allocated in the 700MHz band to all Mobile Operators, however, altogether 190MHz spectrum is allocated in the 2.6GHz band. Around 300MHz was awarded to the Mobile Operators in Germany because of the 5G auction in 2019.
Providing high mobile broadband services requires aggregating different frequency bands. Enabling the same bandwidth in larger geographical areas is challenging because the high-frequency bands need more mobile towers than the low-frequency bands. That is due to the different propagation characteristics of the various bands.
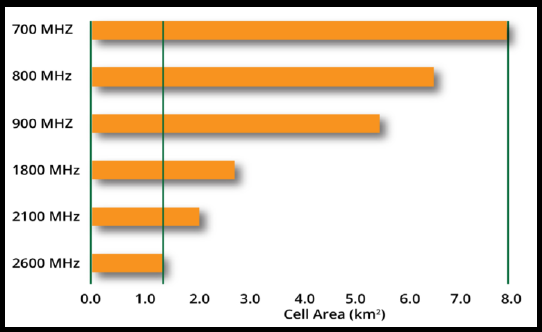
Higher frequency bands have smaller coverage areas; therefore, the question is how many new high-capacity sites need to be built in addition to the low-frequency mobile base stations to provide the required high-capacity coverage areas.
Based on the different sizes of the coverage areas, statistically around eight times more 2.6GHz sites would be needed as 700MHz to provide the same coverage. The size of Germany is 357,386 km2, so if you want to have the proper coverage in every corner of Germany, you would need around 44,673 sites with 700 MHz and 357,386 sites with 2.6GHz. In reality, you could cover 99% of the population with 25,000 locations according to a post by Hannes Ametsreiter, the CEO of Vodafone Germany [16]. The real question is how many sites need to be upgraded or newly built to enable a traffic control application with high-capacity sites on all the German roads. Just indicating the mobile rollout costs, 50.000 new sites would cost around 6.6 Billion Euros according to the same post by Hannes Ametsreiter [16].
Network connectivity for a large number of traffic objects
Network connectivity would be required for all active objects in a traffic situation, including all engine-based and man-powered vehicles. The question is how many new objects need to be connected to the mobile networks because of the new traffic systems.
There might be one engine-based vehicle per every two family members. Just as a comparison: in 2017, there were more than 57.5 million registered vehicles in Germany, with 45.8 million cars, 4.3 million motorcycles, and 3.1 million trucks and tractors [1]. Germany’s population is 83 million.
The man-powered vehicles, like bicycles and all other objects, like pedestrians, need to get connected to the network as well. This means that roughly one connectivity per member of a given population. Considering the fact that almost all members of the population have already a mobile phone, the number of new connectivity would be relatively low.
The high-level calculation is that the number of connected objects could be around 1.5 times the population.
The engine-based vehicles will demand the majority of the new connections. Most likely, the number of new connectivity demands for vehicles follows the number of new vehicle sales. 3.4 million cars were sold in Germany in 2018 [14], which indicates around 15-20 years to swap the majority of the cars in the country. It means that on the one hand the growing number of connectivity could be managed more easily, however, on the other hand, any traffic control solutions need to consider a lot of passive but moving objects for a quite long period.
2nd related Network capability: Throughput – bandwidth requirement for transmitting information from the objects
According to the 3GPP TR 22.886 V16.2.0 (2018-12) documents, around 50-60Mbps bandwidth is required over the mobile network for V2x services which support higher autonomy and automation levels. Ultra-high bandwidth requirements, like 700Mbps or even 1Gpbs capacity, would be required by a few of the foreseeable use cases, like as ‘Video data sharing for automated Driving’ or ‘Sharing raw data collected by the sensors of a vehicle for remote processing.’
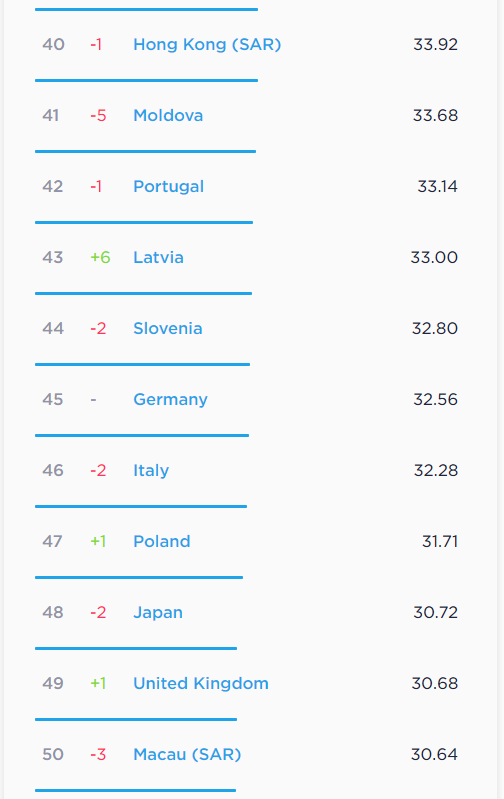
At first sight, we might think that 50-60Mbps bandwidth is not an issue in these days of 2019 because that was available in certain countries in 2019 already as presented by Speedtest.net in the Speedtest Global Index.
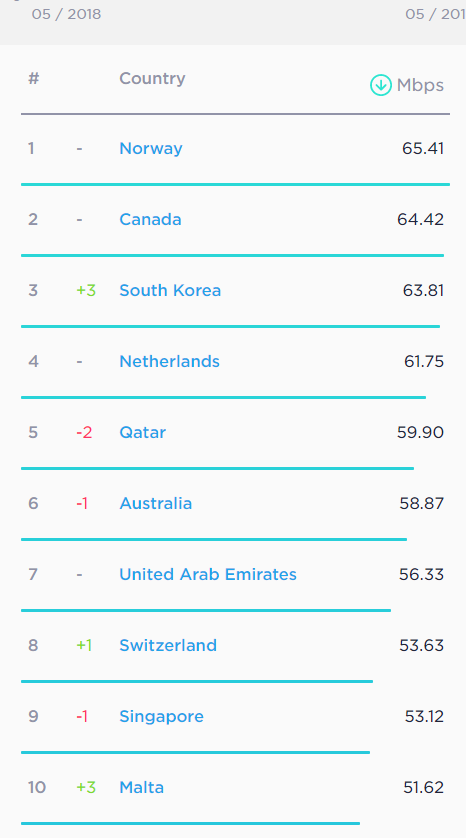
Source https://www.speedtest.net/global-index
Source https://www.speedtest.net/global-index
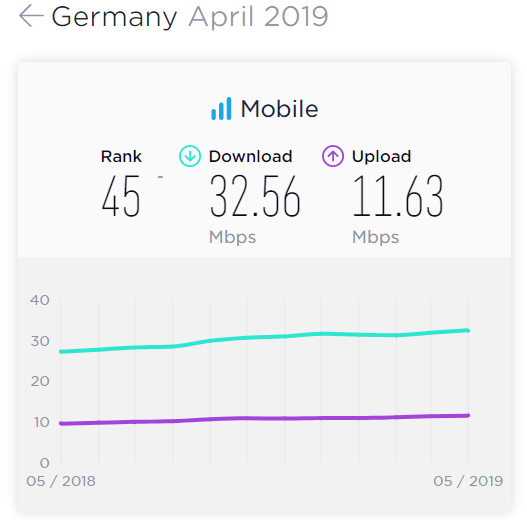
Germany ranked as #45 among the countries with a 32.56 Mbps average download speed in April 2019.
BUT. The issue is that the V2x services require 50-60Mbps UpLoad (UL) speed and not DownLoad (DL). The reason is simple, steering the vehicle remotely and sending down (DL) the new speed and direction coordinates or values to the vehicle could be done via short messages. However, to transmit all information collected or produced by the vehicle itself, would require high UL bandwidth.
If you are considering the UL speeds from the same speedtest.net source: the highest upload speeds in the current 4G networks are in the range of 15-20Mbps for the same countries in the TOP10 DownLoad list. Germany had an average of 11.63Mpbs in UL in April 2019.
Source https://www.speedtest.net/global-index
Higher UL speed requires not only higher-performing operator networks but also better terminal capabilities:
The two main challenges for reaching higher UL speed are: increasing the UL bandwidth of the operator networks and developing the terminals to be able to transmit a higher volume of data:
- Channel allocation for UL traffic: one of the issues is the UL and DL ratio, which is set by the mobile operators over the total available radio channels (mobile operators typically use the same ratio in a given country). Traditionally more channels are allocated to downlink than to uplink, as the ratio is typically 3:1 or 4:1. These channel allocations might need to be changed, especially targeting multiple 100Mbps UpLink traffic.
- Terminal capabilities: Current mobile phones or terminals, in general, are not capable of transmitting multiple hundreds of Mbps to the radio antennas, because it would require much more power capacity as of today.
3rd Improved Network capability: Latency – enabling low latency in the mobile networks to support fast communication and reaction time
One of the key aspects of mobile network development is to enable shorter distances therefore lower latency between the applications and the end user.
Moving the application closer to the vehicles
Today applications are located in the clouds. In the future, new functions will appear in those applications, and such new features will require faster information transmission between the application and the vehicle. Faster information transmission will require that applications move out from the clouds and get closer to the vehicles.
In the past, mobile network topology was optimized for providing enough bandwidth and the fastest path to the Internet; to the applications. With the rise of the different new applications and services, the distance between the applications and end-users shall be reduced.
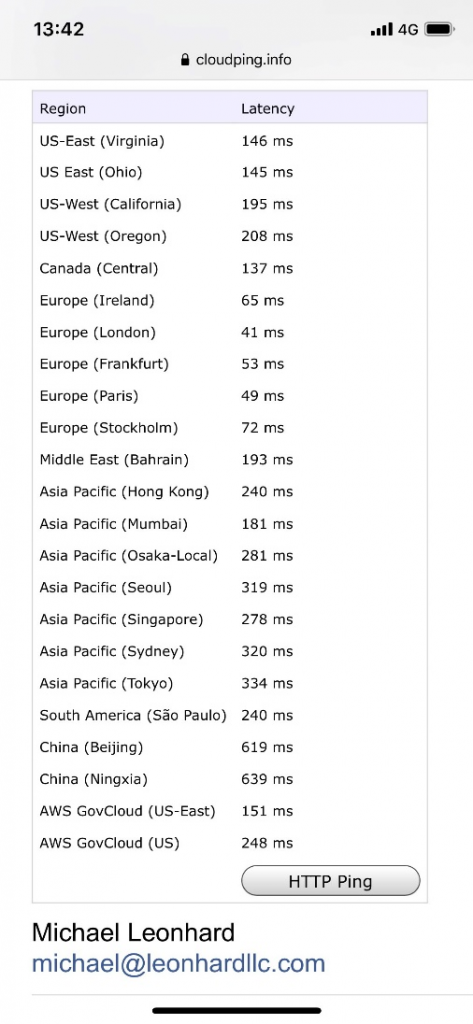
Today the latency to AWS or Google Cloud services is about 47-100ms over the LTE mobile network measured in Dusseldorf, Germany.
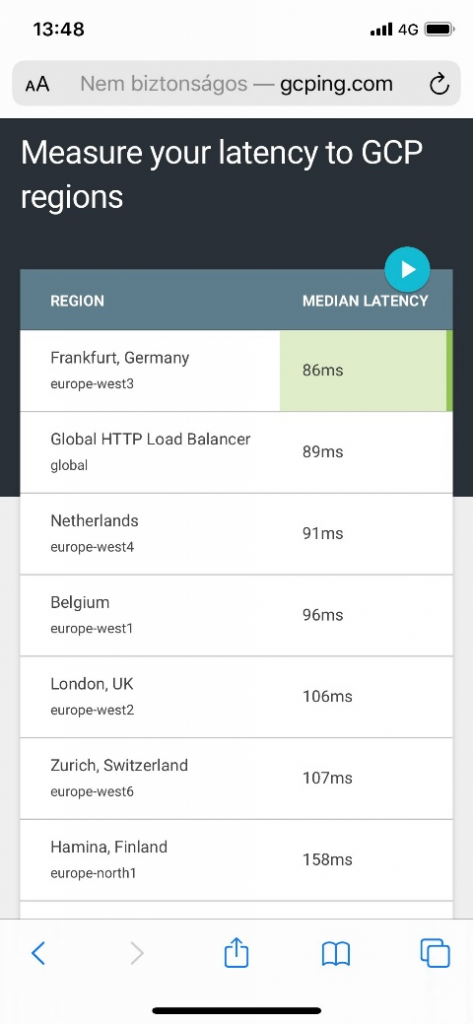
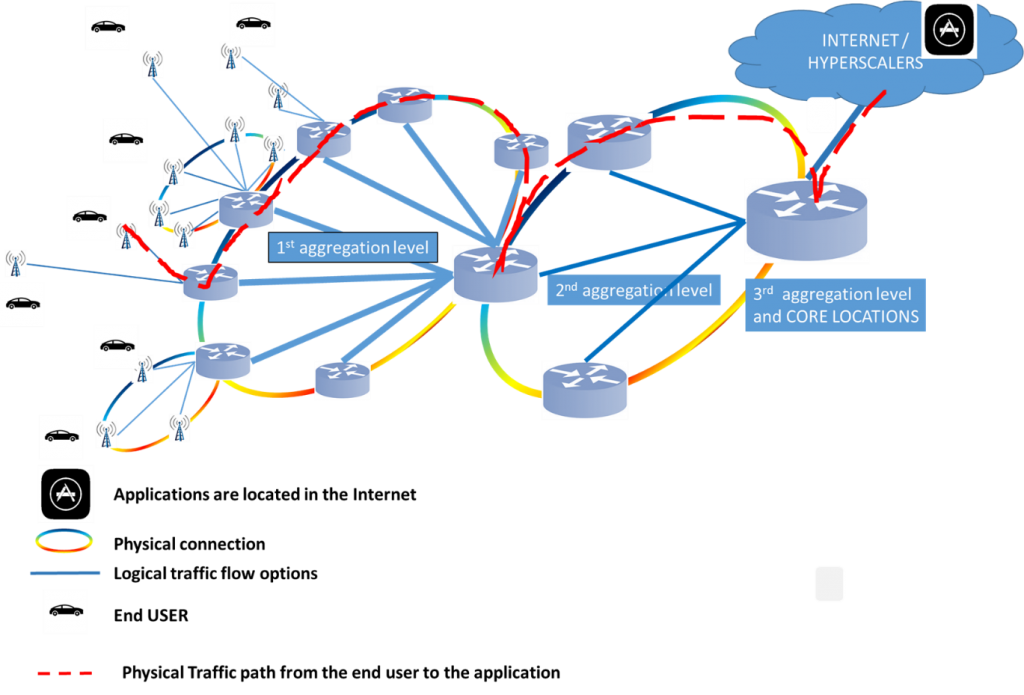
We might need <10ms latency between the traffic control application and the vehicles and other traffic objects in the future. Such a current 40-100ms latency would be too high for traffic control applications; therefore, such a traffic control application needs to be moved closer to the vehicle. Typically, there are multiple locations in an aggregation network, where the compute infrastructure for the traffic control applications could be hosted as depicted in this picture:
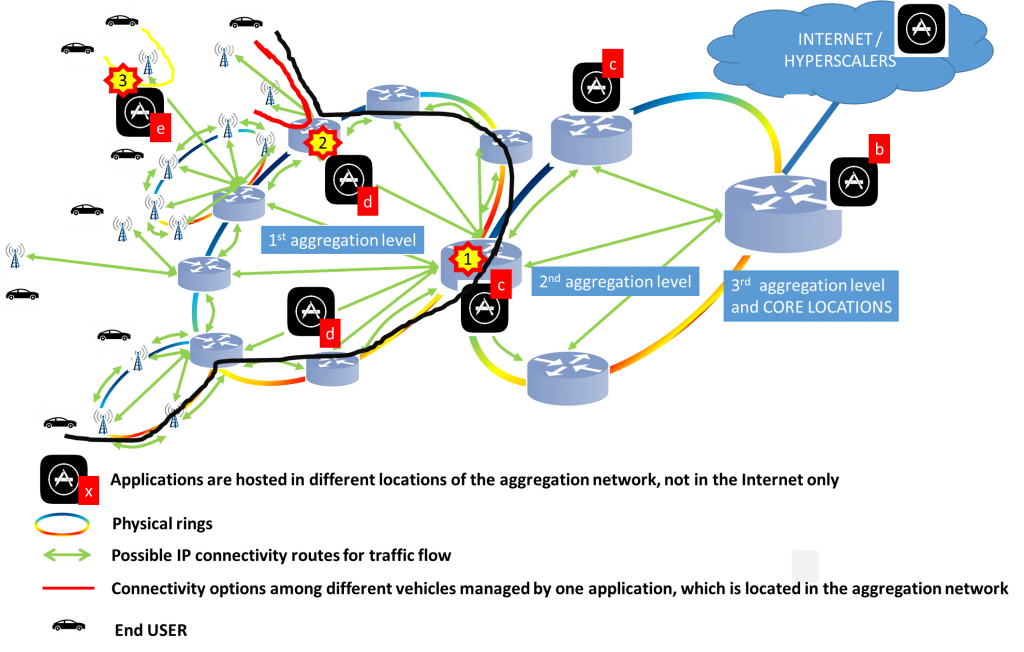
The first traffic flow example is marked with![]() : application is located in a node on the 2nd aggregation level and could fulfil the different service demands (latency, resiliency, mobility) for all sites connected to the specific node through lower aggregation nodes. This traffic flow example is marked black.
: application is located in a node on the 2nd aggregation level and could fulfil the different service demands (latency, resiliency, mobility) for all sites connected to the specific node through lower aggregation nodes. This traffic flow example is marked black.
The second traffic flow example marked with![]() the application is located in the 1st aggregation level from the mobile sites and could fulfil the service demands (latency, resiliency, mobility) for all directly connected mobile sites. This traffic flow example is marked red
the application is located in the 1st aggregation level from the mobile sites and could fulfil the service demands (latency, resiliency, mobility) for all directly connected mobile sites. This traffic flow example is marked red
The third traffic flow example is marked with![]() : applications located directly in the mobile sites and could fulfill the service demands (latency, resiliency, mobility) for all vehicles connected to that specific site. This traffic flow example is marked yellow
: applications located directly in the mobile sites and could fulfill the service demands (latency, resiliency, mobility) for all vehicles connected to that specific site. This traffic flow example is marked yellow
— TO BE CONTINUED —
References
[1] Bundesanstalt für Straßenwesen (BASt) Federal Highway Research Institute: Traffic and Accident Data Summary Statistics – Germany. https://www.bast.de/BASt_2017/EN/Publications/Media/Traffic-and-Accident-Data.pdf?__blob=publicationFile&v=7
[2] European Road Safety Observatory: Traffic Safety Basic Facts 2017, https://ec.europa.eu/transport/road_safety/sites/roadsafety/files/pdf/statistics/dacota/bfs2017_main_figures.pdf
[3] United States Department of Transportation, National Highway Traffic Safety Administration: Automated Vehicles for Safety https://www.nhtsa.gov/technology-innovation/automated-vehicles-safety
[4] 3GPP TR 22.886 V16.2.0 (2018-12) 3rd Generation Partnership Project; Technical Specification Group Services and System Aspects; Study on enhancement of 3GPP Support for 5G V2X Services (Release 16) https://www.3gpp.org/DynaReport/22886.htm
[5] Road traffic safety https://en.wikipedia.org/wiki/Road_traffic_safety
[6] Wikipedia – Braking distance. https://en.wikipedia.org/wiki/Braking_distance
[7] © The State of Queensland 1995–2019 Queensland Government Stopping distances on wet and dry roads https://www.qld.gov.au/transport/safety/road-safety/driving-safely/stopping-distances/graph
[8] Hagberg Media AB, Distances (reaction, braking, stopping) https://korkortonline.se/en/theory/reaction-braking-stopping/
[9] Commonwealth of Virginia, 2019 46.2-880. Tables of speed and stopping distances. https://law.lis.virginia.gov/vacode/46.2-880/
[10] Dipl.-Ing. Strommer Johannes Stopping Distance, Acceleration, Speed https://www.johannes-strommer.com/diverses/pages-in-english/stopping-distance-acceleration-speed/#hinweise
[11] James R. Davis (?) Bicycle Brake Stop Calculator http://www.muggaccinos.com/Liability/BrakeCalcs/Braking_formula/TwoDistanceToBrakeToStopFormulae.htm
[12] Self-Driving Cars: Levels of Automation https://www.hsdl.org/?view&did=801463
[13] Recent developments and future plans of 700 MHz Band https://www.itu.int/en/ITU-D/Regional-
Presence/ArabStates/Documents/events/2018/FUHF/Presentations/GSMAMohamed%
20Abbes%20Updated%20Slides.pdf
[14] Passenger car sales in Germany 2004-2018 https://www.statista.com/statistics/416827/passenger-carsales-
in-germany/
[15] Frequencies ITU Region 1: (Europe) https://www.spectrummonitoring.com/frequencies/#Germany
[16] 5G auction in Germany: https://www.linkedin.com/pulse/auktionsschaden-reparieren-bevor-es-zu-spat-isthannes-ametsreiter/
[17] Latency to each AWS™ region. https://www.cloudping.info/
[18] Latency to Google Compute Engine regions. http://www.gcping.com/
[19] European Telecommunications Standards Institute (ETSI): Local Dynamic Map (LDM) Draft ETSI EN
302 895 V1.0.0 (2014-01) ETSI: https://www.etsi.org/deliver/etsi_en/302800_302899/302895/01.00.00_20/en_302895v010000a.pdf
[20] European Telecommunications Standards Institute (ETSI): Local Dynamic Map (LDM) ETSI TR 102
863 V1.1.1 (2011-06) https://www.etsi.org/deliver/etsi_tr/102800_102899/102863/01.01.01_60/tr_102863v010101p.pdf
[21] Tom Krishner, Associated Press, Tesla expects to have fully self-driving cars by next year https://www.pbs.org/newshour/economy/tesla-set-to-unveil-fully-self-driving-car-technology
[22] . Hideki Shimada, Akihiro Yamaguchi, Hiroaki Takada, Kenya Sato: Implementation and Evaluation of
Local Dynamic Map in Safety Driving Systems. https://www.scirp.org/pdf/JTTs_2015033117331447.pdf
[23] SAFESPOT INTEGRATED PROJECT http://www.safespot-eu.org/
[24] European Commission: a European Strategy on Cooperative Intelligent Transport Systems (C-ITS)
https://ec.europa.eu/transport/sites/transport/files/com20160766_en.pdf
[25] Vinayak V. Dixit,* Sai Chand, and Divya J. Nair, Jun Xu,: Autonomous Vehicles: Disengagements,
Accidents and Reaction Times. https://www.ncbi.nlm.nih.gov/pmc/articles/PMC5173339/
[26] Infineon Technologies AG: From assisted to automated driving https://www.infineon.com/cms/en/discoveries/adas-to-ad/
[27] German Association of the Automotive Industry (VDA): Automation From Driver Assistance
Systems to Automated Driving. https://www.vda.de/dam/vda/publications/2015/automation.pdf
[28] Steven E. Shladover, Dongyan Su, and Xiao-Yun Lu: Impacts
of Cooperative Adaptive Cruise Control on Freeway Traffic Flow. https://pdfs.semanticscholar.org/2361/bb30032f7465e75f14c8501489b1d4f0f50e.pdf?_ga=2.257164745.392530511.1562395449-951355635.1562395449